
ACKNOWLEDGEMENT:
Figure
|
Source of Figure
|
Figure 1
|
http://www.bbc.co.uk
|
Figure 2
|
http://everythingmaths.co.za
|
Figure 3
|
www.chemistryland.com
|
Rate of reaction:
The rate of reaction is defined as
the speed of the reaction, or completion of the reaction per unit time. There
are some techniques employed to measure this. For example:
i.
Determining Rate of reaction using
the gas evolved per unit time:
Figure 1:

Figure 1
shows the apparatus in which a gas is released as a product. The gas syringe is
used to collect the releasing gas and its volume is recorded at different
intervals of time and the results are tabulated as shown in Table 1:
Serial
Number
|
Time
(mins)
|
Volume of
gas collected
(cm3)
|
1.
|
0
|
0
|
2.
|
2
|
12
|
3.
|
4
|
|
4.
|
6
|
28
|
5.
|
8
|
34
|
6.
|
10
|
36
|
7.
|
12
|
38
|
8.
|
14
|
40
|
9.
|
16
|
40
|
10.
|
18
|
40
|
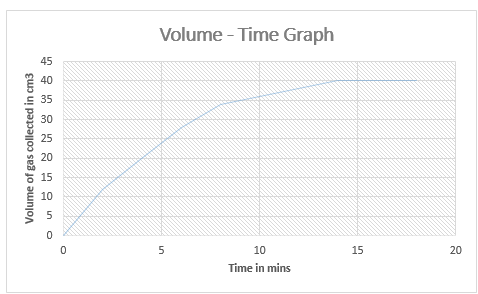
A graph
from the tabulated readings can be plotted to show the progress hence rate of
the reaction:
Graph 1: (Volume – Time Graph)
ii.
Determining Rate of Precipitation
Reactions:
In precipitation reactions; a
transparent beaker is placed on a cross marked on a paper as shown in Figure2.
Figure 2:
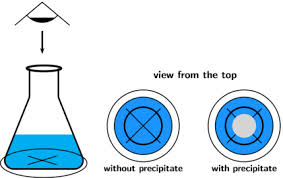
As the precipitation reaction
proceeds, the mark gradually disappears (when viewed from the top of the
beaker). For such cases, rate of the reaction is given by the time taken for
the cross to disappear.
iii.
Determining Rate of reaction using
Weight measurement:
Figure 3:

This
apparatus is used in experiments in which the weight of the contents of the
flask changes with respect to time. Usually for such reactions, a gas is
evolved and the loss in weight is tabulated at regular time intervals, for
example as shown in Table 2:
Serial
number
|
Time
(mins)
|
Weight of
the flask
(g)
|
Loss in weight
of the flask (g)
|
1.
|
0
|
100
|
0
|
2.
|
2
|
88
|
12
|
3.
|
4
|
80
|
8
|
4.
|
6
|
74
|
6
|
5.
|
8
|
70
|
4
|
6.
|
10
|
66
|
4
|
7.
|
12
|
62
|
4
|
8.
|
14
|
60
|
2
|
9.
|
16
|
60
|
0
|
Rate of the
reaction is given by:
Rate = ,
A graph
from the tabulated readings can be plotted to show the progress hence rate of
the reaction:
Graph 2: (Weight of the flask – Time
Graph)

